Open source · MIT license
Know where your
tokens go.
Parses session files from Factory Droid, indexes them into a local SQLite cache, and gives you three ways to explore token consumption, model usage, and project activity.
What it does
Three interfaces, one local SQLite engine. Immediate insights with zero overhead and a single-command setup.
CLI
Rich-powered terminal commands for overviews, daily/weekly/monthly breakdowns, and top session reports. Supports --json output for scripting.
TUI
Interactive Textual dashboard with tabs, sparklines, and auto-refresh every 30 seconds. Press r to refresh, s to sync, q to quit.
Web
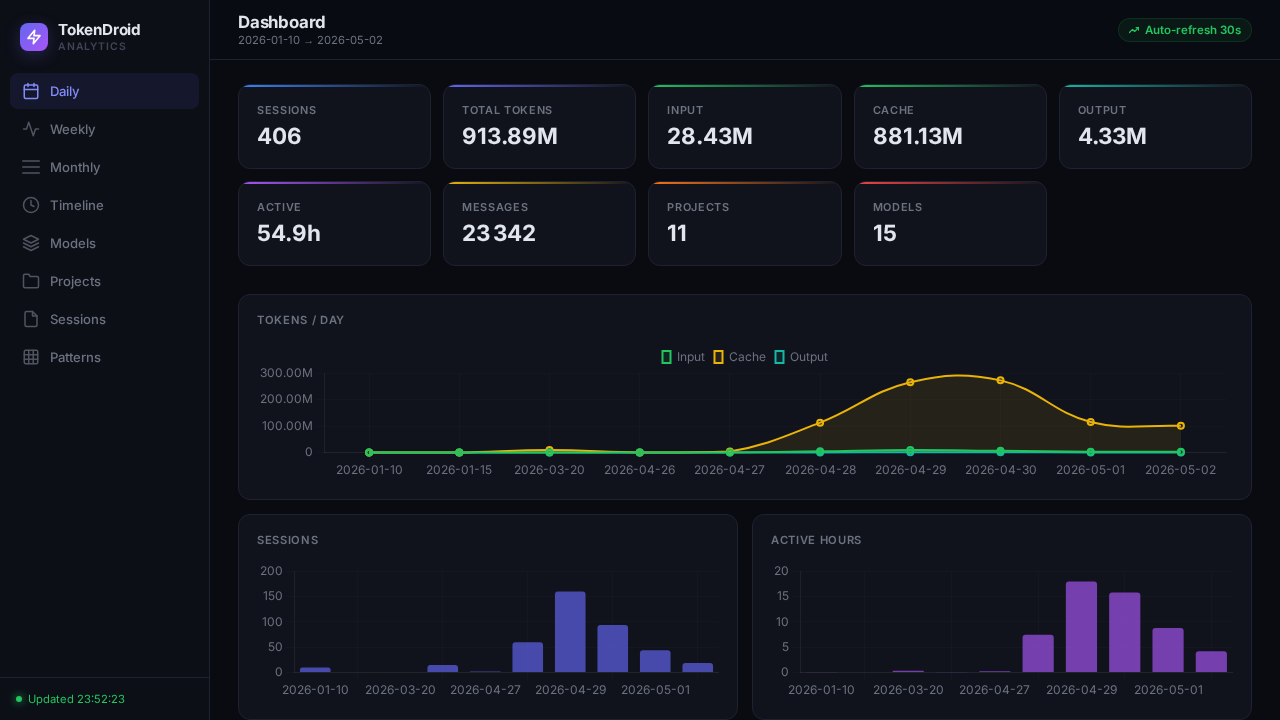
Full-featured browser dashboard with Chart.js graphs, sortable tables, hourly/weekday heatmaps, and a single-page JSON API.
SQLite cache
Incremental sync from session files. Once indexed, queries run locally against the cache. No network required after sync.
JSON API
REST endpoints at /api/dashboard, /api/stats, /api/sync. Filter by project, model, and date range.
Zero config
Sync and go. Data lives in ~/.factory/sessions/. The cache holds everything else. One binary, no dependencies.
Get started
# clone and install
git clone https://github.com/nils010485/TokenDroid.git
cd TokenDroid
uv tool install .

# sync your session data
tokendroid sync

# see your numbers
tokendroid stat overview
Interfaces
CLI
tokendroid stat overview for global KPIs, models, projects.
tokendroid stat daily --from 2025-01-01 for time-bounded queries.
tokendroid stat top -n 20 for the heaviest sessions.
TUI
tokendroid tui launches an interactive dashboard. Tab between views, see sparklines, auto-refresh every 30 seconds.
Web
tokendroid web serves the dashboard at localhost:random port. Charts, tables, heatmaps, API.
--port 9000 for a custom port. --no-open to skip the browser.
How it works
~/.factory/sessions/ → parser.py → db.py → display/ | web/